
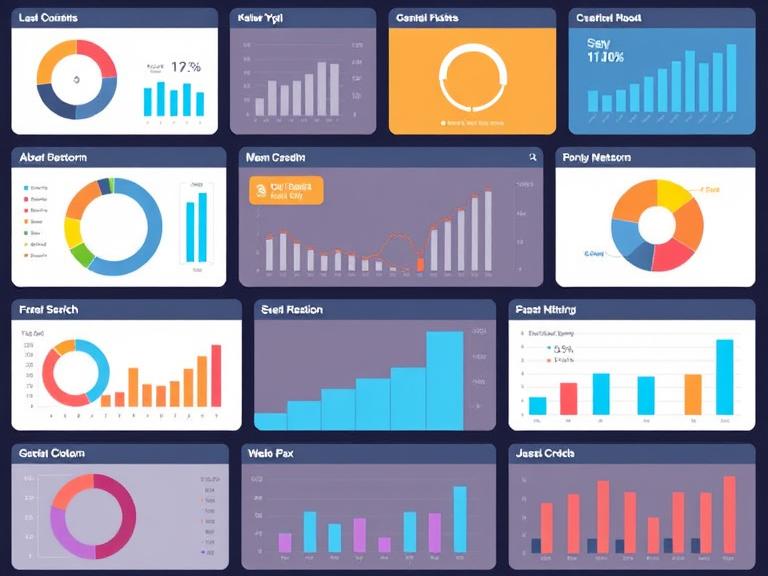
As your business grows, data becomes your compass. A KPI dashboard (Key Performance Indicator dashboard) consolidates your most important metrics into a single, visual interface—allowing you to track performance, spot trends, and make fast decisions.
What to include in your dashboard depends on your goals and industry, but common categories are:
- Sales & Revenue
- Monthly Recurring Revenue (MRR)
- Customer Acquisition Cost (CAC)
- Sales conversion rate
- Marketing
- Website traffic
- Cost per lead
- Email open and click-through rates
- Customer Success
- Net Promoter Score (NPS)
- Churn rate
- Average support response time
- Finance
- Profit margins
- Burn rate
- Cash runway
- Operations
- Project completion rates
- Inventory turnover
- Employee productivity
Use tools like Google Data Studio, Tableau, Power BI, or even Excel/Sheets to build dynamic dashboards. Integrate them with CRMs, e-commerce platforms, and finance tools to update data in real time.
Dashboards should be accessible to decision-makers and reviewed regularly (weekly or monthly). Avoid clutter—focus on the metrics that directly impact strategy.
In growth mode, flying blind isn’t an option. KPI dashboards turn your data into action—so you can scale with clarity and confidence.


Leave a Reply